
品质至上,客户至上,您的满意就是我们的目标
当前位置: 首页 > 新闻动态
法国农业科学院Fred教授介绍MCP1植物表型研究项目
发表时间: 点击:1761
来源:来源:IPPN植物表型组织
分享:
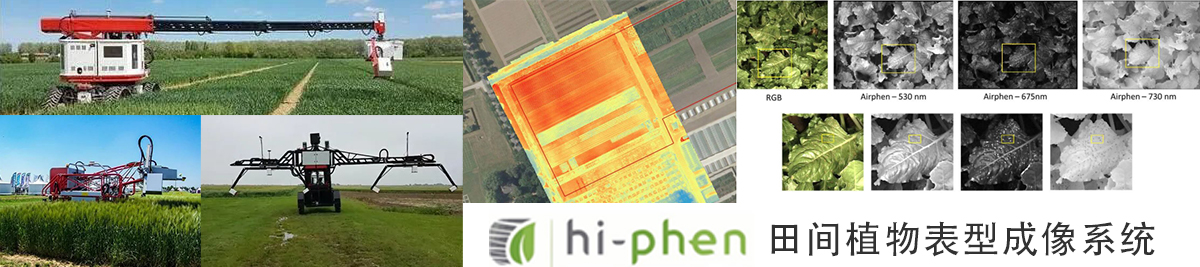
较近IPPN植物表型组织网站刊发了法国农业科学院Fred教授撰写的关MCP1 - 传感器学、传感器和方法的发展的介绍。MCP1负责人 Frédéric Baret (EMMAH, INRA)介绍到:“我们研发用于基因分析的测量系统和流程,可将传感器输出转为准确、有效以及可传递的变量。较近技术进展提供了广阔范围的传感器、系统,用于鉴别土壤、作物以及环境条件,结果数据整合到PHIS信息系统 (MCP2)”。介绍中还提到了Phenomobile系统,目前该系统已被hiphen公司商业化。

Phenomobile原创研发:该系统研发用于有效估计叶片垂直分布、穗数等 ,系统同时配有功能成像用多光谱测量系统。 系统可全自动对微区块进行取样,搭载高分辨率RGB相机、多光谱相机以及 LiDAR系统,系统配置了闪光灯,测量可不依赖于外部光照条件。还开发了自动数据处理平台。

https://www.phenome-emphasis.fr/phenome_eng/Methodological-projects/MCP1-Sensorics-and-methods
MCP1 - Sensorics, development of sensors and methods
MCP1 leader: Frédéric Baret (EMMAH, INRA)
We develop measurement systems and workflows that transform sensor outputs into accurate, precise and heritable variables used for genetic analyses. Recent technological advances offer a wide range of sensors and systems to characterize soil, crop and environmental conditions. The resulting data are integrated into the PHIS information system (MCP2).
Environmental characterisation
· Light in controlled conditions: The incident light in a greenhouse is heterogeneous (up to two-fold variation over 1m). Measurements and simulated sun beam trajectories through greenhouse structures allows estimation of the light received by each plant every day of the year.

Spatial variability of light transmission in a greenhouse cumulated over one month, due to greenhouse structures, and time course of light transmission in six places over one day. Note that light can vary by 100% over short distances
· Sensor network: A common set of sensors is used in the infrastructure; outputs are handled by the Phenome-Emphasis information system. Wireless sensors of temperature and light were developed for monitoring organ micro-climate via tens of sensors installed in controlled conditions and field.
Functional traits in controlled and field conditions
· Estimation of whole-plant photosynthesis and stomatal conductance. The use of gas exchange, i.e the refrence technique for photosynthesis and stomatal conductance, is impossible at high throughput. We evaluate the amount of light intercepted by 1000s of plants in controlled or field conditions, using 3D reconstructions of plants placed in virtual canopies17. Inversion of physical equations allows estimation of the of canopy photosynthesis and stomatal conductance8. The figure shows that whole-plant stomatal conductance measured at high throughput is a good proxi of that measured with gas exchanges, for evaluating its genetic variability.

· Development of an original Phenomobile. It was developed for accurate estimation of, e.g. vertical distribution of leaf area or spike number, together with multispectral measurements for functional imaging. It sample all the microplots in a completely automatic way and carrying high-resolution cameras, multispectral cameras and LiDAR, the whole of these instruments working in an active way with flashes, making the measurement independent from the illumination conditions. An automatic data processing platform is developed.

Left, a field phenotyping platform with microplots. Middle, the phenomobile. Right, an example of 3D images of a wheat microplot obtained from the LiDAR carried by the phenomobile.
· Drone Imaging. This technology equips all field platforms, with a RGB, multispectral and thermal infrared cameras. A pipeline was developed for extraction of canopy height, plant/organ number per m2, intercepted light, chlorophyll content and canopy temperature.

Drone imaging, stem number identified by machine learning and comparison of estimated values with manual measurements
· Automatic organ detection. Pipelines allow organ recognition based on deep learning6. In controlled conditions, they drive a camera that takes detailed images at short distance (2). A similar pipeline is installed on the field Phenomobile for recognizing and counting organs or plants.
· Structuration and integration of imaging workflows in a modelling platform(OpenAlea). This includes wrapping image processing libraries (imageJ macro call, OpenCV) and formalization of workflows.
In the next years, a priority will be given to the assessment of biotic interactions
· Quantification of biotic stress under field and controlled conditions. Deep learning will be used for for recognition of symptoms such as spots or necrosis in the field. In controlled conditions, 3D plant reconstruction will be used for tracking the time course of symptoms, together with their impact on photosynthesis via imaging.
· Developing methods to assess and mitigate the impact of biotic and abiotic stresses. Integration of phenotyping observations within process models will be explored to assess the impact of stresses and methods to mitigate it via canopy structure (mix of varieties or species). This involves (i) in controlled conditions, 3D characterization and reconstruction of individual plants/genotypes (ii) The generation by users of thousands of virtual canopies associating genotypes, and then the calculation of canopy photosynthesis and diffusion of pathogens. (iii) The test in the field of a limited number of.
· Deployment of the processing pipeline and integration with PHIS. A comprehensive pipeline for processing data acquired with phenomobiles and drones is designed to interact intimately with PHIS to get the ontology basis and the set of metadata required for the processing.


")


