品质至上,客户至上,您的满意就是我们的目标
技术文章
当前位置: 首页 > 技术文章
种子表型组学:多光谱-基于自荧光光谱成像和机器学习算法的大豆种子成熟期可靠识别方法
发表时间:2022-12-05 08:16:56点击:674
来源:北京博普特科技有限公司
分享:
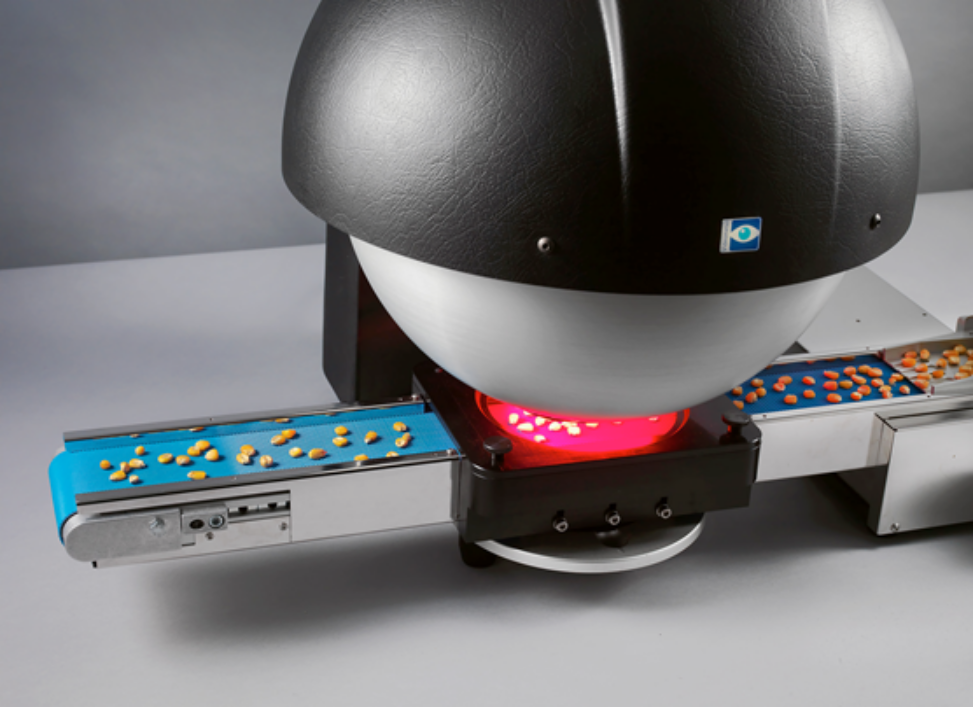
Videometer Lab4多光谱种子表型成像系统是丹麦理工大学与丹麦Videometer公司开发,是用于种子研究先进的多光谱表型成像设备,典型客户为ISTA国际种子检验协会、ESTA欧洲种子检验协会、John Innes Centre、LGC化学家集团、奥胡斯大学等等,利用该系统发表的文章已经超过300篇。
Videometer种子表型表型成像系统可测量种子如尺寸、颜色、形状等,间接测定种子参数如种子纯度、发芽百分比、发芽率、种子健康度、种子成熟度、中寿命等。种子活力综合种子活力是种子发芽和出苗率、幼苗生长的潜势、植株抗逆能力和生产潜力的总和(发芽和出苗期间的活性水平与行为),是种子品质的重要指标,具体包括吸涨后旺盛的代谢强度、出苗能力、抗逆性、发芽速度及同步性、幼苗发育与产量潜力。种子活力是植物的重要表型特征,传统检测方法包括低温测试、高温加速衰老测试、幼苗生长测定等。
该系统也可以对细菌、虫卵、真菌等进行高通量成像测量,进行病理学、毒理学或其它研究。对于拟南芥等冠层平展的植物,可以进行自动的叶片计数等。

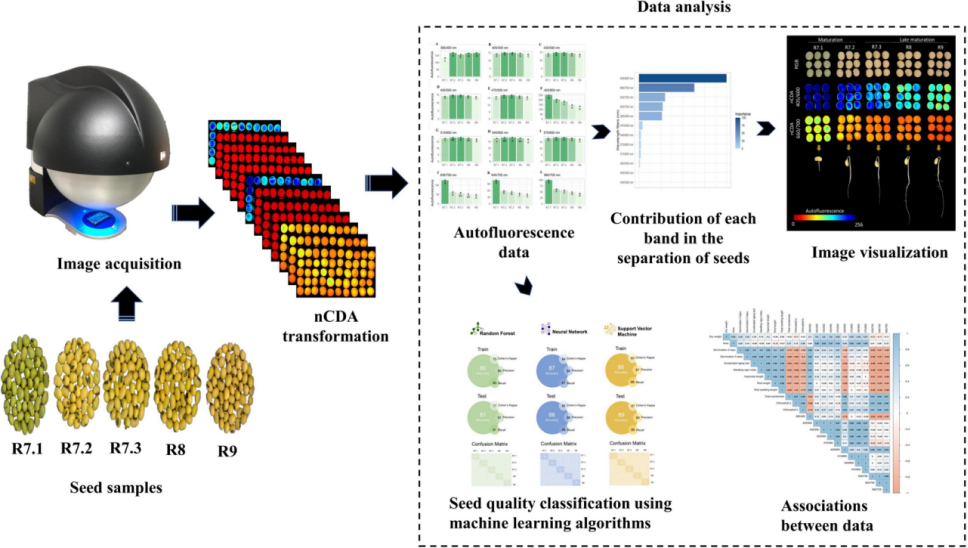
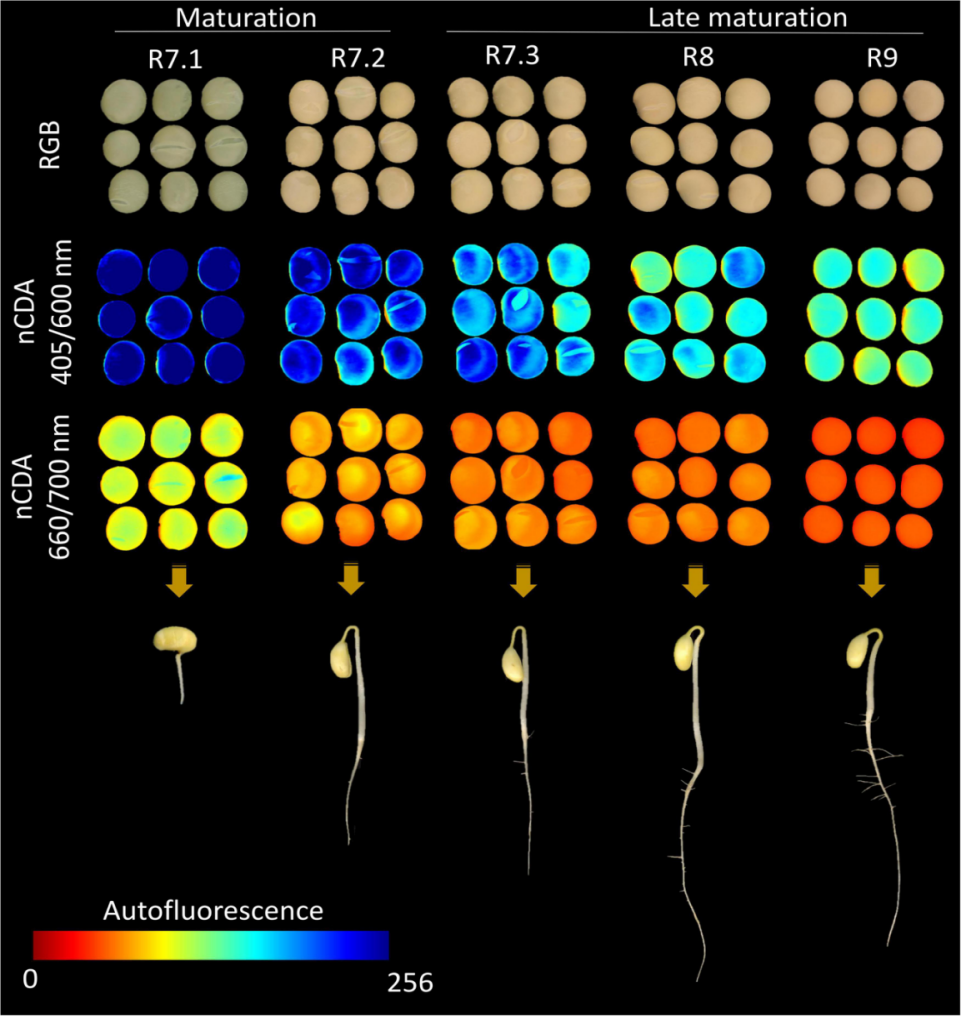
近年来,技术创新在种子质量诊断方面取得了重大进展。具有优异生理质量的种子是那些具有最高生理成熟度的种子,而快速和精确的分离方法的结合有助于提高田间表现。自体荧光光谱成像是一种基于种子组织中荧光团荧光信号的创新技术,对种子质量具有生物学意义。因此,通过这种技术,可以对不同成熟阶段的种子进行分类。为了测试这一点,我们生产了一种商业品种(MG/BR 46“Conquista”)的植物,并在五个繁殖(R)阶段收集种子:R7.1(成熟开始)、R7.2(大量成熟)、R7.3(种子与母株分离)、R8(收获点)和R9(最终成熟)。从在不同激发/发射组合下捕获的图像中提取自体荧光信号。同时,我们研究了不同成熟期种子的物理参数、发芽、活力和色素的动态。为了验证基于自体荧光光谱成像预测种子成熟阶段的准确性,我们基于三种算法创建了机器学习模型:(i)随机森林、(ii)神经网络和(iii)支持向量机。在这里,我们报道了前所未有地使用自体荧光光谱技术来分类大豆种子的成熟阶段,特别是使用叶绿素a(660/700nm)和b(405/600nm)的激发/发射组合。总之,机器学习算法在种子成熟的不同阶段表现出高性能分割。结果表明,大豆种子的成熟阶段在叶绿素的波长上具有自身的荧光光谱特性,这允许将该技术用作种子成熟度和优异生理质量的标记。

自荧光光谱成像和数据提取

使用VideometerLab4从25个种子的四个重复中捕获多光谱图像™ 仪器(Videometer A/S,Herlev,丹麦)。该系统可以使用不同激发波长的LED发光二极管结合光学滤波器(长通滤波器)捕获高分辨率自体荧光光谱图像(2192×2192像素)。使用双面胶带将种子放置在乙酸片(5.0cm×8.5cm)上的相同位置(左侧的种脐)。在图像采集之前,调整光设置以优化每种照明类型的选通时间,从而获得更好的信噪比,以直接比较捕获的图像。使用代表性样本校准灯光设置,并保存所有后续图像。使用不同的激发/发射组合在1分钟内以一个序列生成每个样品的自荧光光谱图像:365/400、405/500、430/500、450/500、470/500、405/600、515/600、540/600、570/600、630/700、645/700和660/700 nm。使用VideometerLab提取自体荧光数据™ 软件(3.14.9版)。为此,应用基于阈值的分割图像技术将种子从背景中分离出来,背景由零表示。在分割的种子中,应用标准化正则判别分析(nCDA)算法来逐像素突出每个激发/发射组合的自体荧光信号。nCDA算法使用10%的修剪平均值,消除了离群值(数据中最低的10%和最高的10%)的影响(Barboza da Silva等人,2021b),将灰度图像转换为带有红-绿-蓝色码的分数图像(Bianchini等人,2021)。自体荧光图像中的像素值取决于荧光团的浓度。也使用相同的传感器采集RGB图像。他们被捕获以将肉眼不可见的种子特征与自体荧光光谱图像进行比较。
A Reliable Method to Recognize Soybean Seed Maturation Stages Based on Autofluorescence-Spectral Imaging Combined With Machine Learning Algorithms
Front. Plant Sci., 14 June 2022
Sec. Technical Advances in Plant Science
https://doi.org/10.3389/fpls.2022.914287
In recent years, technological innovations have allowed significant advances in the diagnosis of seed quality. Seeds with superior physiological quality are those with the highest level of physiological maturity and the integration of rapid and precise methods to separate them contributes to better performance in the field. Autofluorescence-spectral imaging is an innovative technique based on fluorescence signals from fluorophores present in seed tissues, which have biological implications for seed quality. Thus, through this technique, it would be possible to classify seeds in different maturation stages. To test this, we produced plants of a commercial cultivar (MG/BR 46 “Conquista”) and collected the seeds at five reproductive (R) stages: R7.1 (beginning of maturity), R7.2 (mass maturity), R7.3 (seed disconnected from the mother plant), R8 (harvest point), and R9 (final maturity). Autofluorescence signals were extracted from images captured at different excitation/emission combinations. In parallel, we investigated physical parameters, germination, vigor and the dynamics of pigments in seeds from different maturation stages. To verify the accuracy in predicting the seed maturation stages based on autofluorescence-spectral imaging, we created machine learning models based on three algorithms: (i) random forest, (ii) neural network, and (iii) support vector machine. Here, we reported the unprecedented use of the autofluorescence-spectral technique to classify the maturation stages of soybean seeds, especially using the excitation/emission combination of chlorophyll a (660/700 nm) and b (405/600 nm). Taken together, the machine learning algorithms showed high performance segmenting the different stages of seed maturation. In summary, our results demonstrated that the maturation stages of soybean seeds have their autofluorescence-spectral identity in the wavelengths of chlorophylls, which allows the use of this technique as a marker of seed maturity and superior physiological quality.
Autofluorescence-Spectral Imaging and Data Extraction
Multispectral images were captured from four replicates of 25 seeds using a VideometerLab4™ instrument (Videometer A/S, Herlev, Denmark). This system can capture high resolution autofluorescence-spectral images (2192 × 2192 pixels) using light-emitting diodes at different excitation wavelengths combined with optical filters (long-pass filters). The seeds were placed on an acetate sheet (5.0 cm × 8.5 cm) in the same position (hilum to the left) using double-sided adhesive tape. Before image acquisition, the light setting was adjusted to optimize the strobe time of each illumination type, resulting in a better signal-to-noise ratio such that the captured images could be directly comparable. Light setup was calibrated using a representative sample and saved for all subsequent images. Autofluorescence-spectral images of each sample were generated in one sequence during 1 min using different excitation/emission combinations: 365/400, 405/500, 430/500, 450/500, 470/500, 405/600, 515/600, 540/600, 570/600, 630/700, 645/700, and 660/700 nm. Autofluorescence data were extracted using VideometerLab™ software (version 3.14.9). For this, a segmentation image technique based on thresholding was applied to separate the seeds from the background, which was represented by zero. In the segmented seeds, a normalized canonical discriminant analysis (nCDA) algorithm was applied to highlight the autofluorescence signals pixel-to-pixel for each excitation/emission combination. The nCDA algorithm uses a 10% trimmed mean, eliminating the influence of outliers (the lowest 10% and the highest 10% of the data) (Barboza da Silva et al., 2021b), transforming grayscale images into score images with red-green-blue color codes (Bianchini et al., 2021). The pixel values in the autofluorescence images depend on the concentration of fluorophores. RGB images were also acquired using the same sensor. They were captured to compare seed characteristics that are not visible to the naked eye with autofluorescence-spectral images.
相关阅读
Videometer种子表型组学:多光谱成像作为菠菜种子健康检测的潜在工具
Videometer种子表型组学:多光谱图像分析在种子种质库管理中的应用
Videometer种子表型组学:利用可见光、近红外多光谱和化学计量学对不同番茄种子品种的分类
Videometer种子表型组学:使用多光谱成像和化学计量学方法在线鉴别水稻种子
Videometer种子表型组学:使用多光谱成像预测蓖麻种子的活力
Videometer种子表型组学:甜菜种子加工损伤的多光谱图像分类
种子表型组学:利用多光谱成像和化学计量学方法对大豆种子进行无损鉴别
种子表型组学:Videometer多光谱成像种子质量评估的新工具
种子表型组学:基于可见-近红外多光谱图像数据的偏最小二乘判别分析检测菠菜种子的发芽能力和胚芽长度
种子表型组学:使用灰度共生矩阵和机器学习技术识别单倍体玉米种子
种子表型组学:通过射线照相和多光谱图像分析测定小麦种子中的侵染
种子表型组学:盐胁迫下九个高羊茅品种的种子萌发和幼苗生长参数
种子表型组学:基于多光谱和共振成像技术的麻疯树种子健康分析新方法
种子表型组学:多光谱成像结合多变量分析的单株紫花苜蓿种子品种鉴别
种子表型组学:通过多光谱成像分析对自然老化的紫花苜蓿种子进行无损鉴定
种子表型组学:自动荧光光谱成像作为一种快速、无损和可靠地评估大豆种子质量的创新方法
种子表型组学:一种利用新兴光学技术和人工智能的方法作为新标记评估花生种子质量
种子表型组学:多光谱成像结合机器学习方法快速无损检测玉米中玉米赤霉烯酮
种子表型组学:基于多光谱成像技术快速无损检测紫花苜蓿人工老化种子