品质至上,客户至上,您的满意就是我们的目标
技术文章
当前位置: 首页 > 技术文章
多光谱食品品质可视化:通过光谱和仿生传感器和数据融合评估腌制鸡肉Souvlaki的微生物破坏和质量
发表时间:2022-11-18 15:47:45点击:779
来源:北京博普特科技有限公司
分享:
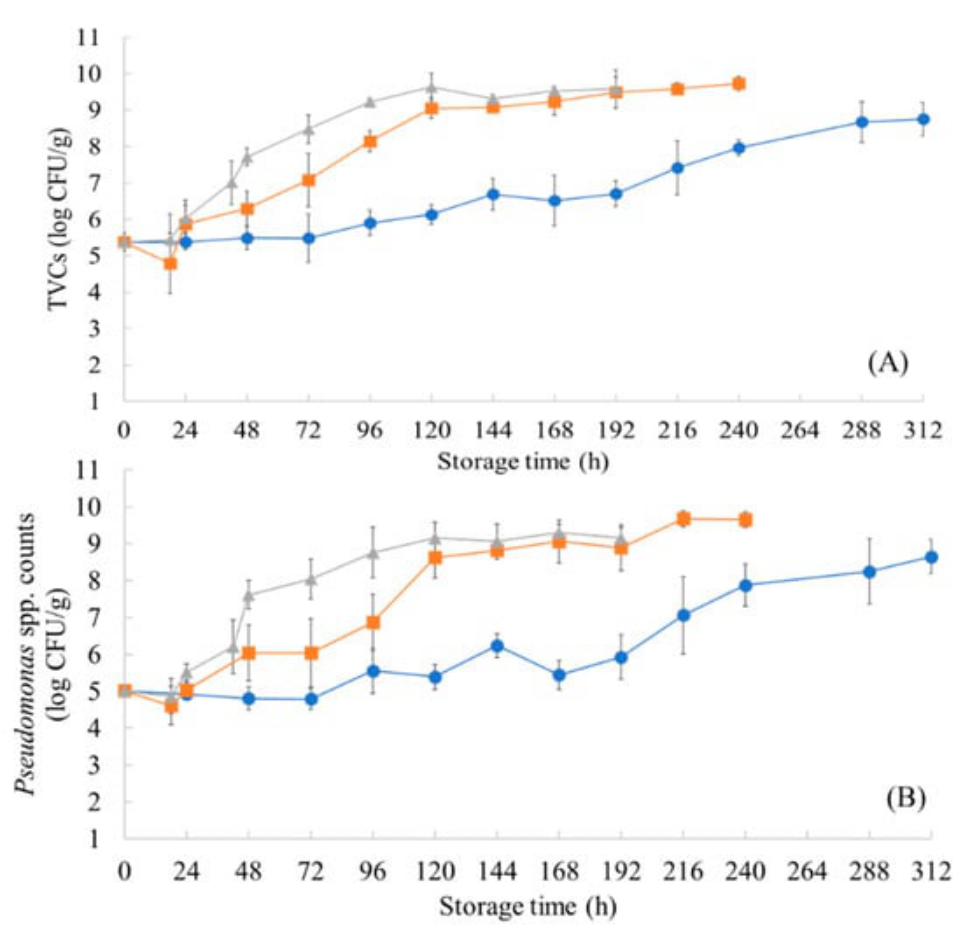
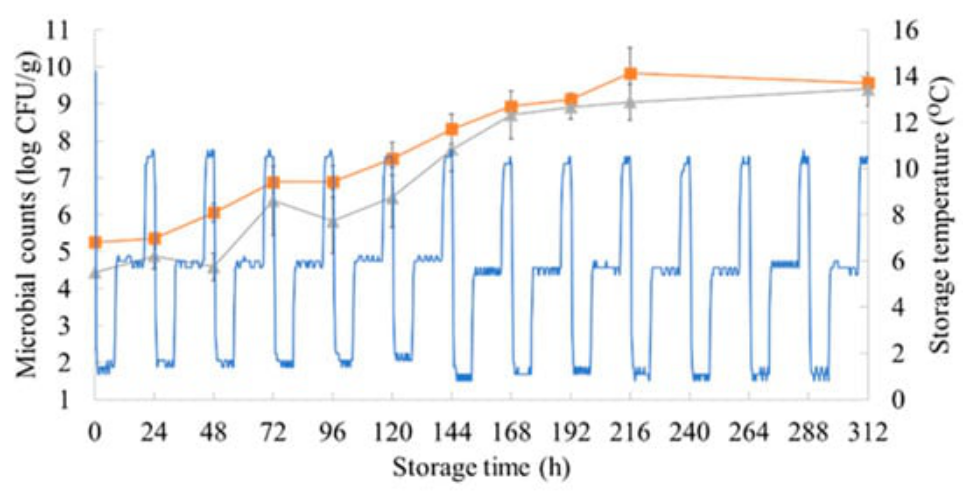
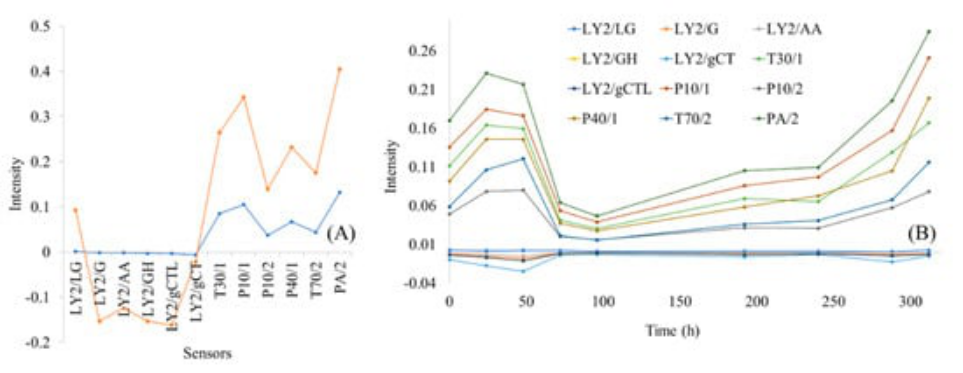
傅里叶变换红外光谱(FT-IR)、多光谱成像(MSI)和电子鼻(E-nose)被单独或组合实施,以试图调查和识别家禽腐败现象的复杂性。为此,在有氧条件下,对腌制鸡肉苏夫拉基样品进行储存实验(等温条件:0、5和10°C;动态温度条件:0°C下12小时,5°C下8小时,10°C下4小时)。以预定的间隔对样品进行微生物学分析。,同时,获取FT-IR、MSI和E鼻测量值。开发并验证了偏最小二乘回归(PLS-R)和支持向量机回归(SVM-R)的定量模型(分别用于每个传感器和组合),用于估计腌制鸡肉苏芙兰中的TVC。此外,对将样本分类为两个质量类别(未损坏或损坏)的线性判别分析(LDA)、线性支持向量机(LSVM)和三次支持向量机的分类模型进行了优化和评估。模型性能通过六位不同的分析师和三批不同批次的腌制苏夫拉基获得的数据进行评估。关于通过PLS-R模型估计TVCs,最有效的预测是使用MSI的光谱数据(均方根误差RMSE:0.998 log CFU/g)以及FT-IR/MSI的组合数据(RMSE:0.98log CFU/g)。根据开发的SVM-R模型,MSI和FT-IR/MSI数据得出的预测准确地估计了TVC,RMSE值分别为0.973和0.999 log CFU/g。对于两类模型,使用CSVM算法分析的FT-IR/MSI仪器的组合数据提供了87.5%的总体精度,其次是使用LSVM分析的MSI光谱数据,总体精度为80%。上述发现突出了这些非侵入性快速方法在单独使用和组合使用时评估腌制鸡肉产品腐败的有效性,无论分析师、季节或批次的影响如何。


关键词:家禽;光谱方法;微生物质量;仿生传感器;多元数据分析;数据融合
光谱采集
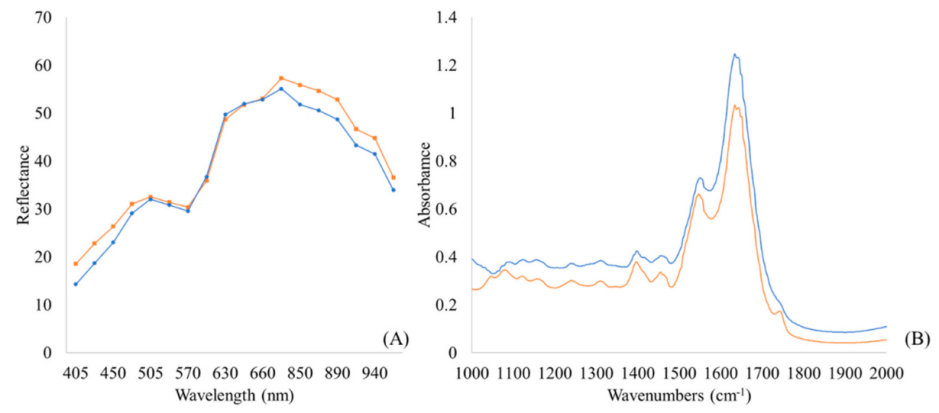
通过使用Videometer Lab仪器(Videometer A/S,Herlev,Denmark)对腌制的鸡肉苏夫拉基样品进行MSI分析,该仪器从18个单色波长(405–970 nm)(即405、435、450、470、505、525、570、590、630、645、660、700、850、870、890、910、940和970 nm)采集样品的表面反射率。先前的研究已经对该传感器的描述和图像采集过程进行了深入讨论[36]。此次采集的最终结果是大小为m×n×18(其中m×n是以像素为单位的图像大小)的数据立方体,其中包含每个样本的空间和光谱数据[37]。在数据分析之前,需要一个额外的步骤,将样本表面上的感兴趣区域(ROI)与包含无用信息的周围区域分离。对于每个图像,通过计算ROI内每个波长的像素强度的平均值和标准差来估计平均反射率光谱。为此,通过使用Videometer Lab 2.12.39版软件(Videometer A/S,Herlev,Denmark),将标准判别分析(CDA)分别应用于每个样本和每个波长。


Assessment of the Microbial Spoilage and Quality of Marinated Chicken Souvlaki through Spectroscopic and Biomimetic Sensors and Data Fusion
Microorganisms2022,10(11), 2251
Abstract
Fourier-transform infrared spectroscopy (FT-IR), multispectral imaging (MSI), and an electronic nose (E-nose) were implemented individually and in combination in an attempt to investigate and, hence, identify the complexity of the phenomenon of spoilage in poultry. For this purpose, marinated chicken souvlaki samples were subjected to storage experiments (isothermal conditions: 0, 5, and 10 °C; dynamic temperature conditions: 12 h at 0 °C, 8 h at 5 °C, and 4 h at 10 °C) under aerobic conditions. At pre-determined intervals, samples were microbiologically analyzed for the enumeration of total viable counts (TVCs) and Pseudomonas spp., while, in parallel, FT-IR, MSI, and E-nose measurements were acquired. Quantitative models of partial least squares–Regression (PLS-R) and support vector machine–regression (SVM-R) (separately for each sensor and in combination) were developed and validated for the estimation of TVCs in marinated chicken souvlaki. Furthermore, classification models of linear discriminant analysis (LDA), linear support vector machine (LSVM), and cubic support vector machines (CSVM) that classified samples into two quality classes (non-spoiled or spoiled) were optimized and evaluated. The model performance was assessed with data obtained by six different analysts and three different batches of marinated souvlaki. Concerning the estimation of the TVCs via the PLS-R model, the most efficient prediction was obtained with spectral data from MSI (root mean squared error—RMSE: 0.998 log CFU/g), as well as with combined data from FT-IR/MSI (RMSE: 0.983 log CFU/g). From the developed SVM-R models, the predictions derived from MSI and FT-IR/MSI data accurately estimated the TVCs with RMSE values of 0.973 and 0.999 log CFU/g, respectively. For the two-class models, the combined data from the FT-IR/MSI instruments analyzed with the CSVM algorithm provided an overall accuracy of 87.5%, followed by the MSI spectral data analyzed with LSVM, with an overall accuracy of 80%. The abovementioned findings highlighted the efficacy of these non-invasive rapid methods when used individually and in combination for the assessment of spoilage in marinated chicken products regardless of the impact of the analyst, season, or batch.
Keywords: poultry; spectroscopic methods; microbiological quality; biomimetic sensor; multivariate data analysis; data fusion
Spectral Acquisition
The marinated chicken souvlaki samples were subjected to MSI analysis by using the Videometer-Lab instrument (Videometer A/S, Herlev, Denmark), which captured the surface reflectance of the samples from 18 monochromatic wavelengths (405–970 nm), namely, 405, 435, 450, 470, 505, 525, 570, 590, 630, 645, 660, 700, 850, 870, 890, 910, 940, and 970 nm. The description of this sensor and the process of image acquisition have been thoroughly discussed in previous studies [36]. The final outcome of this acquisition was a data cube of size m × n × 18 (where m × n is the image size in pixels) containing spatial and spectral data for each sample [37]. Prior to data analysis, an extra step was needed in which the region of interest (ROI) on the sample surface was separated from the surrounding area, which contained non-useful information. For each image, the mean reflectance spectrum was estimated with the calculation of the average value and the standard deviation of the intensity of pixels within the ROI at each wavelength. For this purpose, canonical discriminant analysis (CDA) was applied individually to each sample and for each wavelength by using the Videometer-Lab version 2.12.39 software (Videometer A/S, Herlev, Denmark).
相关阅读
丹麦VideometerSLS/SGT颗粒/粘度/口感评价测量仪
食品品质光谱成像可视化:光谱成像应用于面食小麦籽粒真伪检测的可行性研究
食品品质光谱成像可视化:多光谱成像 (MSI):一种检测掺有马肉的碎牛肉的有前景的方法
食品品质光谱成像可视化:色度计和多光谱图像的肉类颜色测量结果的比较
食品品质光谱成像可视化:利用多光谱成像进行非侵入性污染评估和肉类样品绘图
食品品质光谱成像可视化:使用多光谱成像分析快速无损识别注水牛肉样品
食品品质光谱成像可视化:具有不同亚硝酸盐和硝酸盐还原酶活性的肉相关葡萄球菌在发酵香肠中的颜色形成
食品品质光谱可视化研究:长时间低温热处理的奶牛和公牛的肉韧性与结缔组织特性的关系
食品品质光谱成像可视化:使用 vis/NIR 多光谱成像对微加工苹果的每日新鲜度衰减:初步测试
食品品质光谱成像可视化:多光谱视觉系统与色度计在肉色评估中的比较
食品品质光谱可视化研究:使用光谱成像和三色测量对鲑鱼虾青素颜色进行分类
食品品质光谱可视化研究:长时间低温热处理的奶牛和公牛的肉韧性与结缔组织特性的关系
食品品质光谱可视化研究:高通量多光谱图像处理在食品科学中的应用
食品品质光谱可视化研究:一种基于多光谱图像的肉类腐败检测智能决策支持系统
食品品质光谱可视化研究:多光谱成像在草莓果实品质属性和成熟期测定中的应用
食品品质光谱可视化:多光谱成像技术在阿拉比卡和罗布斯塔咖啡豆鉴别中的应用
多光谱食品品质无损检测:用于快速评估鸡肉汉堡微生物质量的光谱数据