
品质至上,客户至上,您的满意就是我们的目标
技术文章
当前位置: 首页 > 技术文章
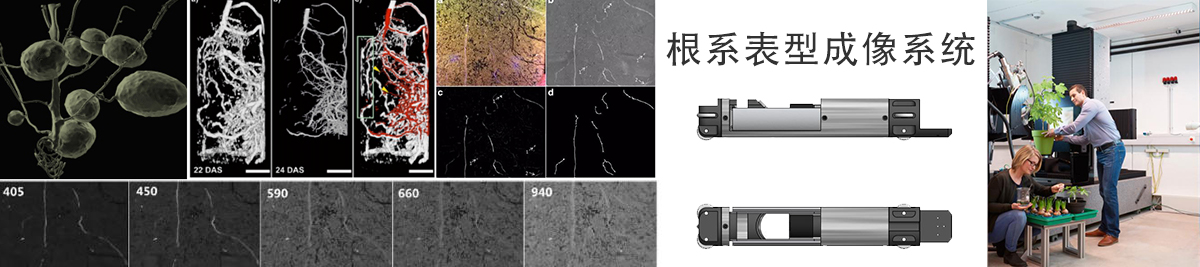
利用Videometer多光谱成像系统对藜麦农艺表型性状进行QTL基因定位
发表时间:2021-07-06 09:42:25点击:784
来源:北京博普特科技有限公司
分享:

来自瓦赫宁格大学的科研人员发表了题为QTL mapping for agromorphological traits in Quinoa (Chenopodium quinoa Willd.)的文章,表型研究中使用了VideometerLab 多光谱成像系统,


VideometerLab (Figure 2) is a system for multispectral imaging that cover reflectance values from 375 to 970 nm (Table 1) with a resolution of 2056 x 2056 pixels, each pixel represents a spectrum. Before image acquisition, the device calibration was performed with assortment of seeds representative of the color diversity in the mapping population. For each genotype of the mapping population and the parents, 80 seeds were randomly selected and placed in a dark plate. The images were labeled into areas of dark background and foreground (the seeds), the resulting images are known as binary-labelled objects (BLOBs) where each BLOB represent a seed. A total of 28 variables were extracted and calculated in the blob toolbox. The size-related variables were area, length and width. The variables associated with color are CIE L*a*b*, intensity, hue, saturation and 19 spectral bands.
Highly correlated color bands were identified in a correlation matrix constructed in Genstat (18th edition). Groups of bands within the visible light spectrum and the infrared region were constructed. The correlation coefficients and p-values are shown in Annex 1. The UV spectrum is represented by 375 nm the unique color band in this region. The visible light spectrum included the categories 405 - 470 nm (blue), 505 - 590 nm (green) and 630 - 700 nm (red). In the infrared region the first category was 780 nm followed by 850-890 nm and 940-970 nm. The wavelengths values for categories including more than one band were estimated as the average of the consecutively correlated bands.CIELAB is a color system that works based on complementary pairs of color dimensions. The color space is recorded in coordinates of L* (psychometric light-ness channel), a* (red-green channel) and b* (yellow-blue channel) including colors beyond the visible spectrum (Figure 3A). Intensity refers to how bright or dull a color looks; bright colors are considered of high intensity while dull colors tend to grey. Hue is a color appearance parameter associated with the principal wavelength in an assortment of colors, just as an observer perceives it. For example, when an object is said to be red, blue, green or a combination, the hue is being specified. Saturation is the colorfulness perceived, it represents the intensity or purity of a hue (Figure 3B).


")


